
Thesis title: Watershed Learning Merge Tree Algorithm Segments Neurons in SEM Images
1、Introduction
The automatic segmentation of neurons is a key step in the reconstruction of neural circuits based on SEM images. It is of great significance to study high-precision and high-efficiency neuron image segmentation algorithms. Based on the existing methods, this paper proposes a watershed learning merging tree algorithm to segment and identify neurons in electron microscopy images.
2、Implementation process
This method combines DCNN and watershed algorithm to segment the neuron EM images to generate superpixel images. Then the superpixel images are merged using the binary tree-based hierarchical structure to obtain the final neuron segmentation results.
3、Innovation
a).In the process of establishing a merge tree, it is necessary to determine the correlation between neighboring superpixels, so as to decide whether to generate a new parent node as a leaf node. This method computes its correlation by training a classifier, which replaces the membership function in the original method and has higher robustness.
b).In the process of parsing the merged tree, it is necessary to train the classifier to calculate the probability that the corresponding region of each tree node belongs to a single neuron. This method adds local rotation-invariant nonlinear features based on the original features and can achieve better classification results.
4、Result analysis
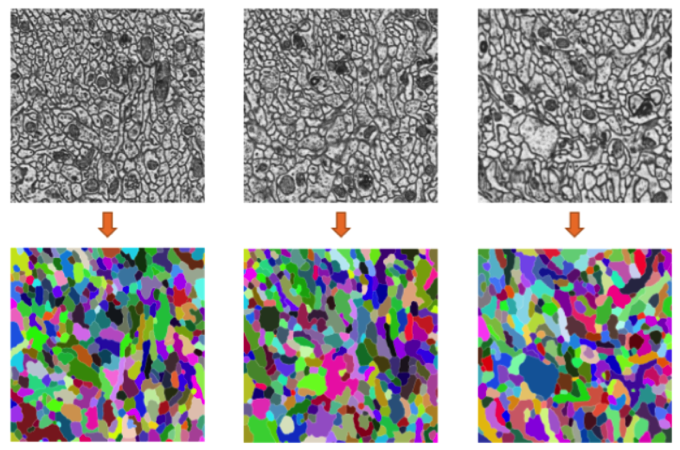
We used the Drosophila mushroom body data set to test the effect of this method. The data was obtained from the microscopic technology analysis platform of the Institute of Automation, Chinese Academy of Sciences. The image resolution is 1024*1024 and it contains a total of 1850 images with a resolution of 5*. 5*50nm/pixel. We labeled 20 of these images, using 10 as the training set and 10 as the test set. We compared the rand error and warping error with the original method. There was a slight decrease in the deformation error, and the random error decreased by 13%, Figure (a). Figure (b) is a partial segmentation result graph.
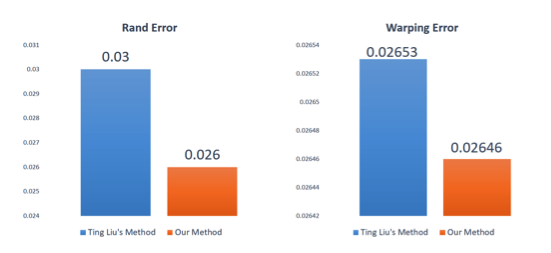
(a)
Website message

Tel: 010-82544385
Zip code: 100190
Address:Flr 2, Bldg Zidonghua, No 95, Zhon gguancun East Rd, Haidian District, Beijing
Chinese Academy of Sciences
Institute of Automation, Chinese Academy of Sciences
China Institute of Automation
Chinese State Graphics Society
National Science Library of Chinese Academy of Sciences
National Key Basic Research Development Plan Network
Ministry of Science and Technology
Ministry of Science and Technology of the People's Republic of China
Website construction of Institute of Automation Powerd by 300.cn SEO Privacy policy